Why planning with gross headcount destroys predictability
When roadmap reviews devolve into opinion volleys, it’s usually because nobody is looking at the same capacity picture. Finance sees the hiring plan, engineering sees outages and support drains, and product sees promised features. An effective capacity model forces everything into one pane.
The data backs it up: teams that institutionalised a Continuous Debt Valuation Approach (CoDVA) reclaimed enough time to boost velocity by 39% and predictability by 60% [1]. DORA’s 2024 report shows elite delivery organisations protect engineering capacity via automation, WIP limits, and steady quality investment [6]. When you treat maintenance as optional, deployment frequency and reliability crater [4].
The lesson: quantify what’s already spoken for, publish it, and invite stakeholders to negotiate scenarios on top of that reality. Here’s how to build an effective capacity model in about 30 minutes.
Effective vs. Gross Capacity: The Core Distinction
Gross capacity is total headcount multiplied by the weeks you think you have. Effective capacityis what’s left after maintenance, support, outages, and leave. Most orgs plan with gross numbers and then wonder why predictable delivery slips. This guide shows how to model effective capacity and make the difference visible to leadership.
Step 1 · Calculate gross capacity: crew × available time
Start in a blank ScopeCone workspace or duplicate the product demo environment. List the people, their roles, and any split allocations. Multiply each role by the weeks you expected to have before maintenance, incidents, or leave show up. That’s your gross capacity baseline.
Collect the unavoidable baseload
Catalogue support rotations, compliance work, operational toil, and planned incidents. Stripe’s Developer Coefficient shows the average team loses 42% of capacity here; top performers keep it to 33% [5].
Log people, roles, and proximities
Note who is discovery-heavy vs. delivery-heavy, which squads share specialists, and which teammates are partially allocated to other departments. Accurate role mixes make the model believable when you share it.
Add planned time off and attrition buffers
Capture PTO, on-call recovery, training, and known hiring gaps. It is better to publish an uncomfortable number than to pretend you can ship with imaginary capacity—time-pressure studies show unrealistic schedules are cited in 93% of failed software projects [3].
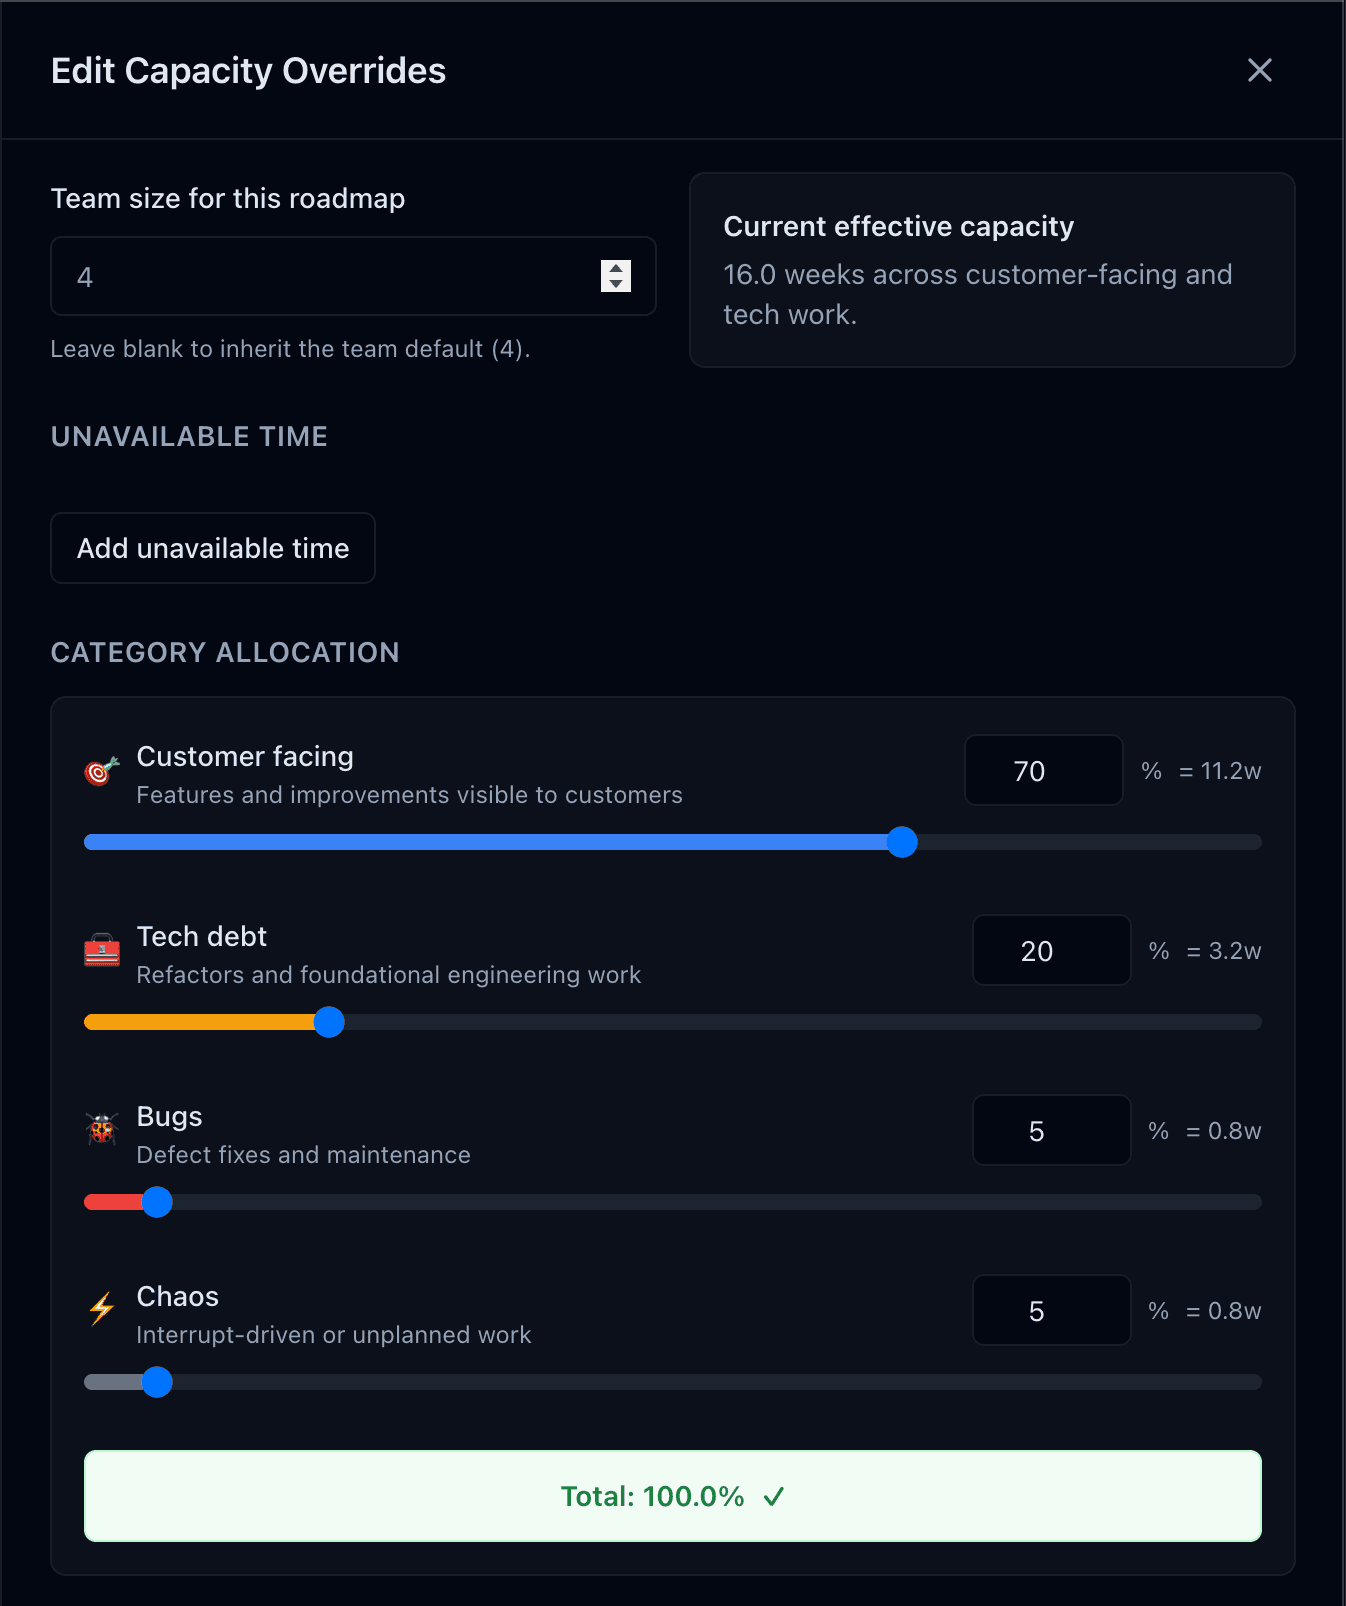
Step 2 · Subtract unavoidable work to find effective capacity
Subtract the unavoidable work you just catalogued from the gross number—what remains is effective capacity. Split those weeks into the intents you actually run: new customer value, platform reliability, experimentation, and ongoing debt paydown. The Delta between 42% and 33% maintenance from Stripe’s benchmark becomes a concrete conversation about regained roadmap energy [5].
Don’t chase perfect precision on day one. Start with a 20–30% maintenance allocation—you can justify it with the CoDVA and continuous-delivery studies—and adjust once you have a quarter of trend data. The goal is to align the trio on “this is what it takes to stay healthy” before promising stretch scope.
“We hold 25% of capacity for quality and automation. It bought us 60% better predictability and reduced release stabilisation work by half.” — Telecom platform team, CoDVA study [1].
Step 3 · Model unavailable time and upstream risks
Great capacity models reflect reality on the ground. Add time off, hiring delays, on-call recovery, and major upstream projects that pull engineers away. Predictive models that skip these signals quickly drift—delivery capability models based on tracker data only beat baselines when they ingest cycle times, ticket types, and people availability together [2].
In ScopeCone, these inputs live in the crew panel and unavailable-time toggles. In a spreadsheet, give them their own rows—visibility matters more than elegance. You can always automate later.
Step 4 · Publish the effective capacity baseline
Once the math is real, the work shifts to storytelling. Your product trio needs a short deck or doc that explains:
- How much capacity is spoken for (maintenance, platform, support)
- What the reclaimed time buys (additional roadmap initiatives, reliability improvements)
- Which assumptions could change (hiring, attrition, surprise compliance)
The checklist below keeps the story consistent.
Expose the math in a shared artifact
Publish the model in ScopeCone or a shared sheet so product, engineering, and finance see the same numbers. Include a readme describing how to interpret “effective capacity” vs. “gross headcount.”
Tie scenarios to executive questions
Present committed, target, and stretch views that answer “What fits if we hold quality?”, “What if we buy back a headcount with automation?”, and “What shifts if roadmap must absorb urgent work?” This keeps leadership focused on trade-offs, not wish lists.
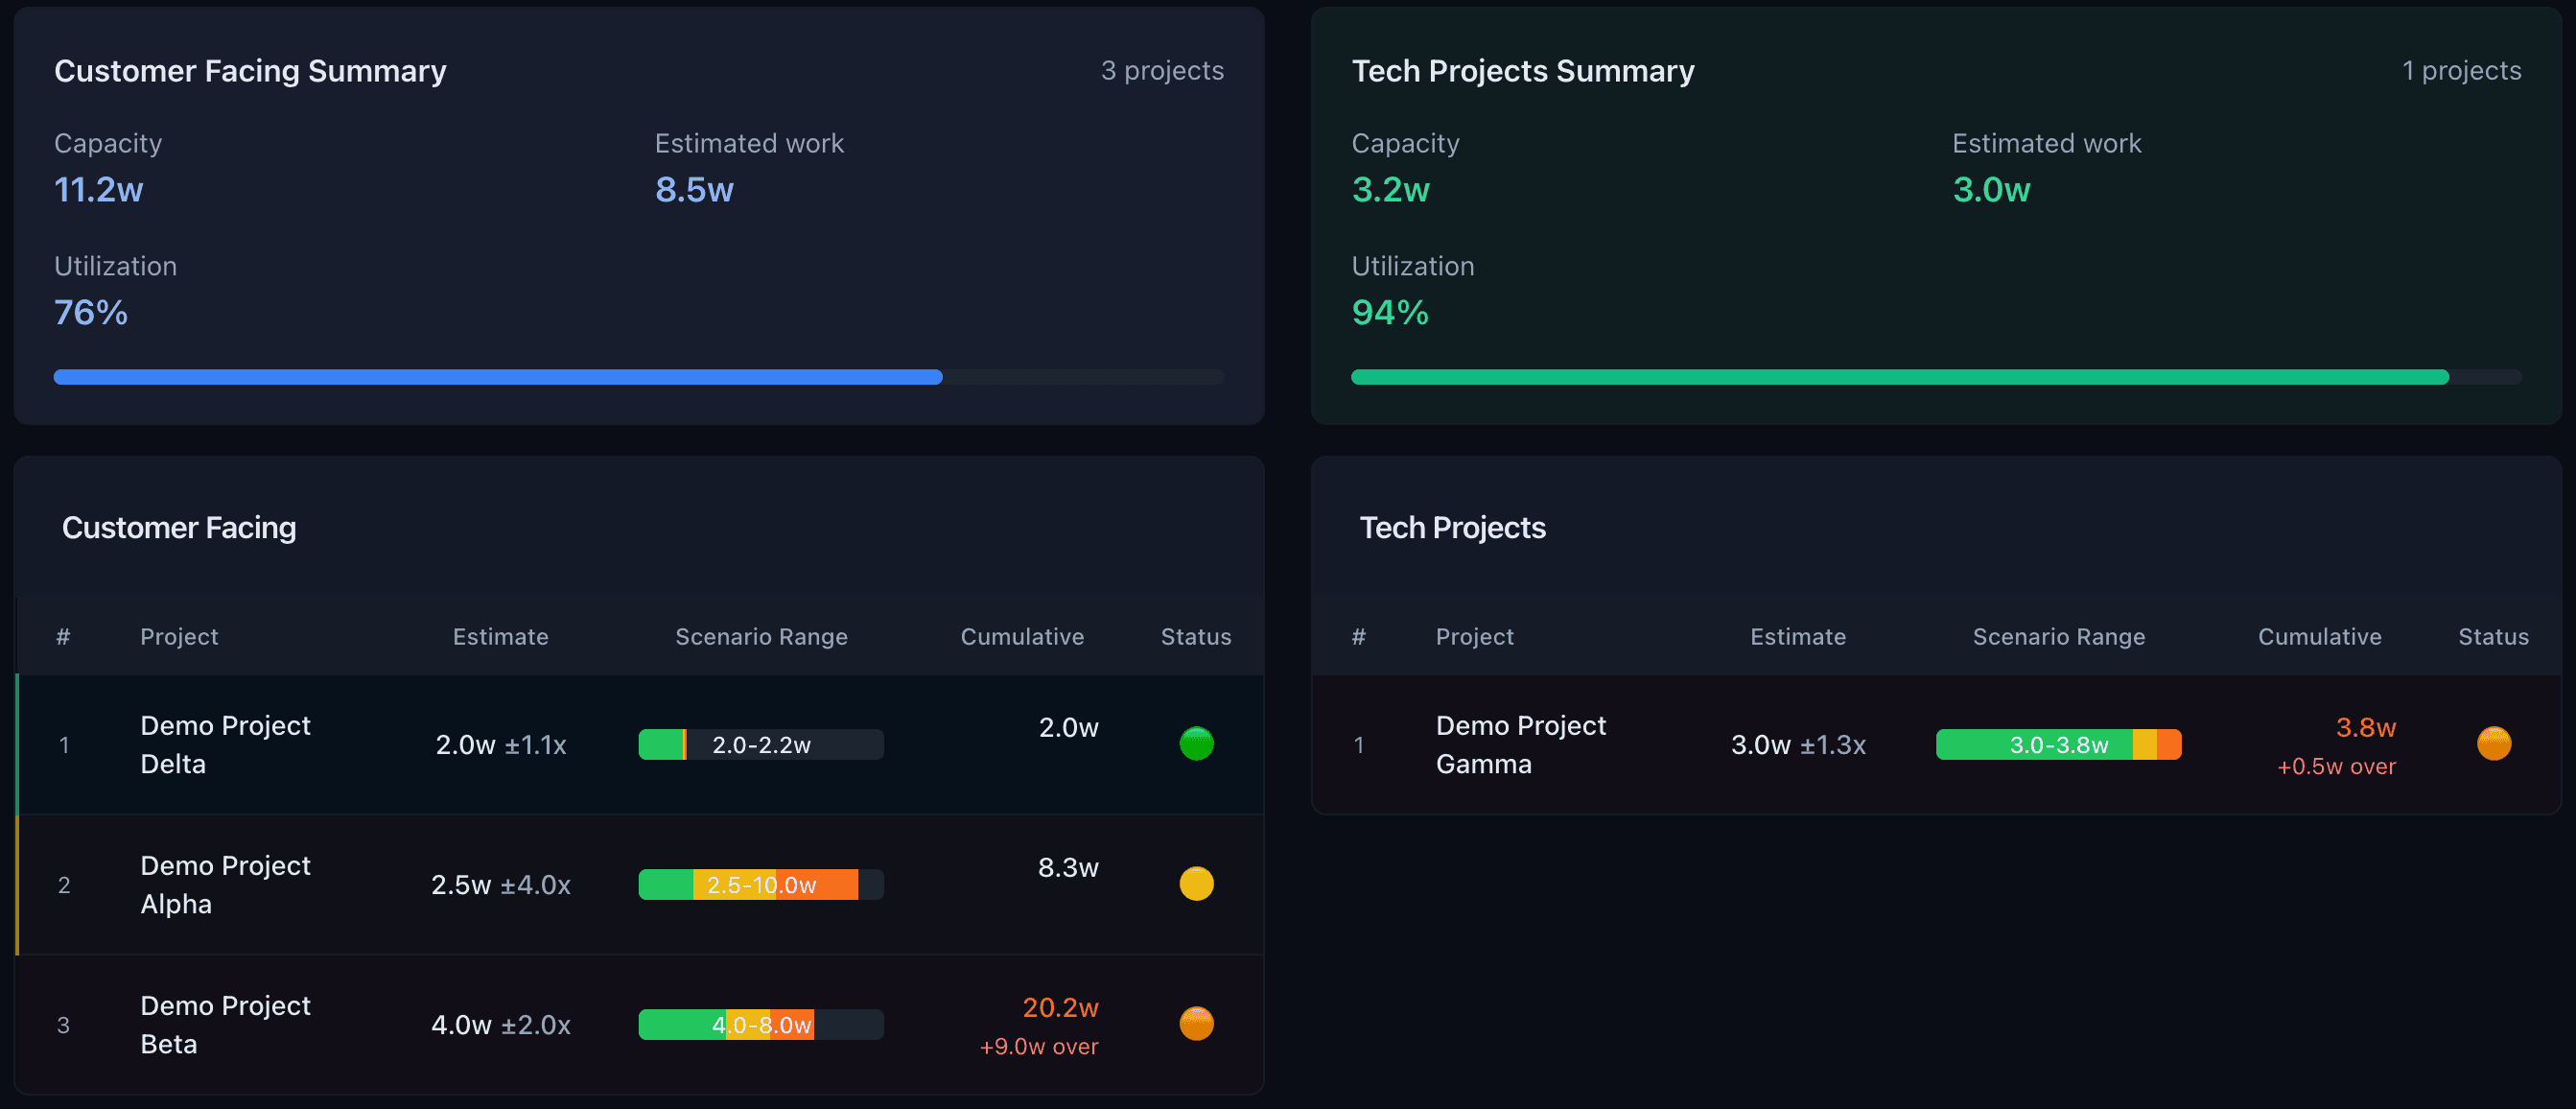
Step 5 · Use effective capacity for scenario planning
Use the effective capacity model as the entry point to scenario planning: committed, target, and stretch mixes that show stakeholders the trade-offs before anyone over-promises. Teams that tracked “debt retirement hours” against roadmap hours saw deployment frequency climb 17–25% after reallocating time toward debt paydown [4]. Show that math alongside your scenarios so the connection is obvious.
Turn this maintenance cost into capacity
Map the dollars you just calculated into real planning slots. Build a shared capacity model, compare scenarios, and decide what debt to attack without guessing.
ScopeCone demo workspace · make it tangible
Load the ScopeCone demo workspace to see the end-to-end flow: calibrate the crew, slide discovery and delivery allocations, mark downtime, and spin up scenario mixes. Replace the sample allocations with your own, then export the summary for your next roadmap review.
For teams not ready to adopt the product yet, replicate the same structure in your spreadsheet. Keep the sheets lightweight: one tab for crew data, one for allocations, one for scenarios. The important part is that everyone uses the same inputs.
Put it on a cadence
Effective capacity models only help when they stay fresh. Run a five-minute review in every sprint ritual:
- Update the crew list and unavailable time.
- Reconcile actual maintenance vs. planned—did emergencies spike? Adjust next sprint.
- Validate the scenario you committed to; if reality drifted, pick a new mix together.
- Capture any follow-up actions (automation investments, hiring escalations, scope swaps).
This cadence keeps product, engineering, and finance aligned on the same numbers and reduces the “do more with less” executive drive-by. Once leaders see capacity data show up every sprint, they stop fighting the math and start negotiating scenarios.
Next: turn capacity gains into roadmap momentum
You now have a model that proves where the time goes and how much you can reclaim. Use it in your next debt review, roadmap pitch, or budgeting cycle. When someone asks “why can’t we just add this feature?”, show them the maintenance delta, the reclaimed engineer-months, and a scenario that would make room—complete with the trade-offs it demands.
That transparency is what rebuilds trust. Nobody expects infinite capacity, but everyone expects honesty about the constraints. An effective capacity model makes reality-based planning the default—and turns roadmap debates from wish lists into strategic trade-offs.